

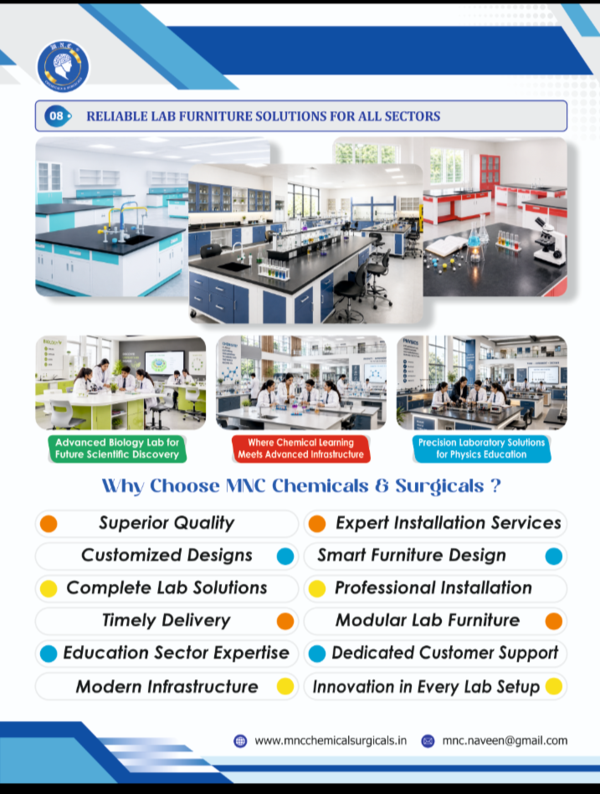
Welcome to the world of MNC Modular Laboratory Furniture! Our top-of-the-line modular laboratory furniture is designed to meet all your laboratory needs with ease and efficiency. Made with high-quality materials, our furniture is not only durable but also customizable to suit your specific requirements. With its sleek and modern design, it will give your lab a professional look while maximizing space utilization. Our modular furniture allows for easy installation and reconfiguration, making it perfect for any type of laboratory setting. Say goodbye to cluttered workspaces and hello to a well-organized and functional lab with MNC Modular Laboratory Furniture. Upgrade your lab today and experience the convenience and versatility of our top-notch modular furniture!
Address
Correspondence Address: Shop No. 20, 2nd Floor, Srirama Tower, Bogulkunta, Telangana
Hyderabad, India, 500001